
Written By:
Monica Kinsey
Monica is a former warehouse operations manager with a passion for workplace safety. Her favorite topics to cover include safety leadership and continuous improvement.
There’s a saying that “you can’t manage what you don’t measure,” and this is particularly true when it comes to safety. One of the best ways to evaluate your EHS program and prevent future incidents or injuries from occurring is to conduct an injury trend analysis.
An injury trend analysis allows you to identify patterns within your safety program. Once you know those patterns, you can use them to make improvements to your approach. Let’s walk through exactly how to perform this analysis and what to look for along the way.
Choosing your injury trend dataset
The first step to completing an injury trend analysis is deciding what type of data you want to use in your deep dive. Determine this at the start, that way you won’t have to go back and pull a whole new set of data later.
Here are some examples of both qualitative and quantitative data you might want to include in your trend analysis:
- Injury type
- Mechanism of injury (MOI)
- Length of employment (for the injured worker)
- Body part(s) injured
- Department/location
- Date or time of injury
- Number of claims (per injured worker)
- Equipment involved
- Claim type (record only [RO], medical only [MO], lost time [ID])
- Claim cost
- Shift
When injuries occur, you should have a system for logging these data points. While EHS software offers the best reporting and documentation capabilities, you can also create a simple template for your team to use.
Check out this simple example of what an injury log might look like:
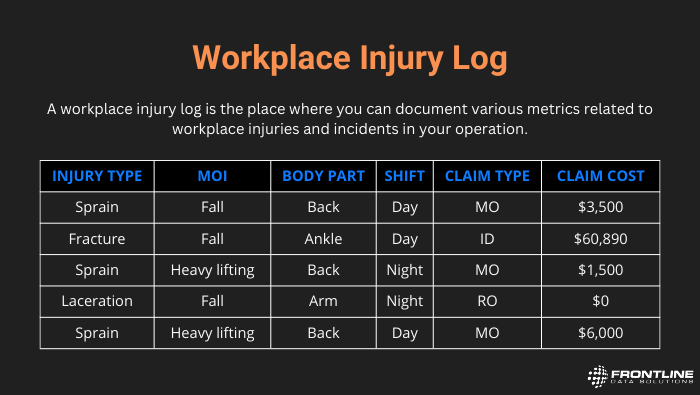
As you can see, pulling information for an injury trend analysis is simple. Indeed, everything appears in a neat, easy-to-read format that anyone on your team can understand.
Afterward, once you identify the type of data to include in your injury log, you must determine what you want to measure. For example, do you want to know when and where most incidents occur? Alternatively, do you want to see which types of incidents cost the most money? Perhaps you want to identify the most common injury and how often it happens.
Ultimately, once you make that determination, you can use the data in the injury log to complete a trend analysis and guide your corrective actions.
Examples of analyses
The bulk of the analysis process involves pulling and organizing data. Therefore, having a comprehensive injury data log plays a critical role. You need a combination of metrics to tell the full story of your EHS performance.
In addition, there are several ways you can create a trend analysis from the information in your injury log. For example, let’s review two different approaches based on the data in the sample log above.
Here is the first example:
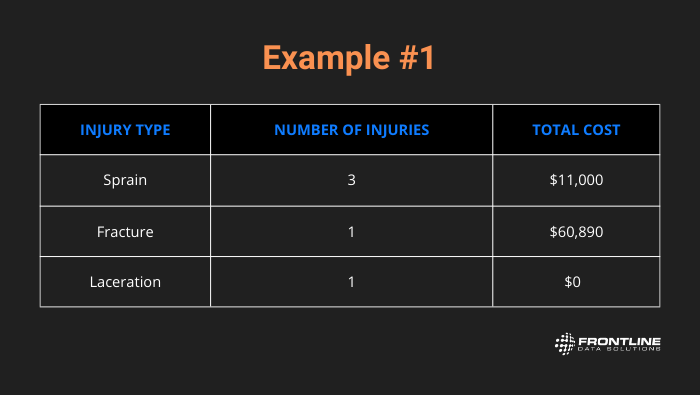
From this analysis, we can understand a few things. First, sprains are most common type of injury in the facility. Second, fractures are by far and away the most expensive type of injury, costing roughly 16 times more than sprains.
Here is the second example:
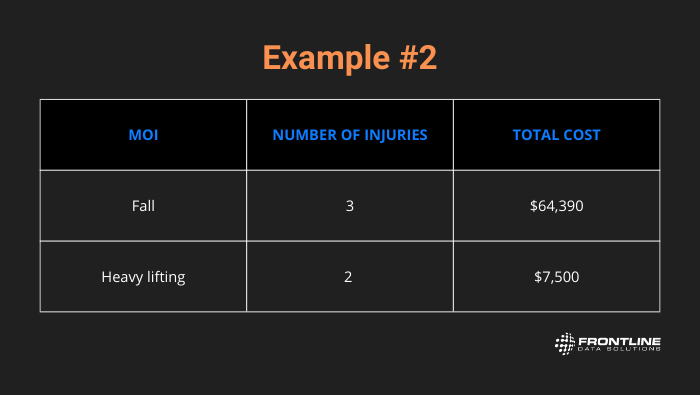
This perspective shows you another insight on injury costs. As you can see, there were two heavy lifting incidents at an average cost per incident of $3,250. When you look at the fall injuries, however, the cost is $21,463 per event.
If, for example, you wanted to reduce injury costs, an analysis like this might show you to focus on fall prevention strategies.
Collecting and analyzing data through an injury trend analysis gives you a clearer understanding of what is happening in your organization. In addition, this process helps you identify problem areas that you can address with a corrective action plan.