

Written By:
Monica Kinsey
Monica is a former warehouse operations manager with a passion for workplace safety. Her favorite topics to cover include safety leadership and continuous improvement.
An EHS dashboard is a tool that shows you important data about the status of your operation. You can use it to gain insight into the performance of your safety programs, standard work, and more.
Because the dashboard serves as a data hub for the team, it’s very important to select the right metrics to track. If you pick data points that don’t align with your site’s goals, you’ll have a hard time making any impactful decisions.
Below, I’ll outline how to go about building your EHS dashboard and what to include.
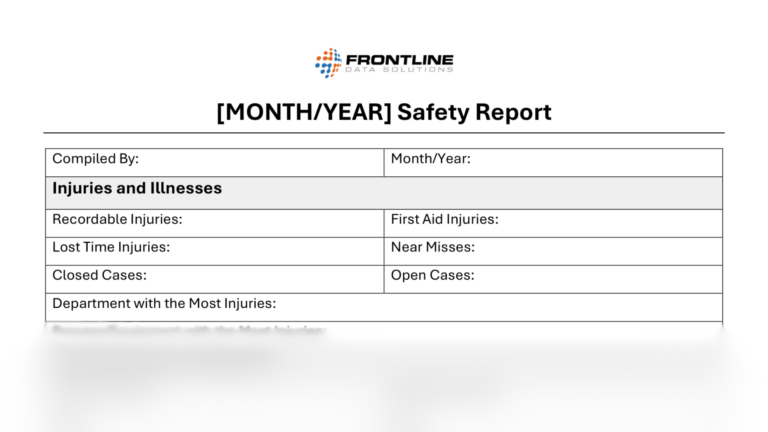
Free template!
Use this monthly safety report template to share all the important EHS metrics you’re collecting in your dashboard.
Start by defining your team’s goals
Before building your EHS dashboard, I’d recommend sitting down with your team and clearly defining your goals. Here are few examples:
- Decrease the incident rate in a specific work area/department.
- Reduce the site’s TRIR.
- Increase employee participation in a safety campaign.
- Improve communication about safety happenings around the site.
- Lower waste spend within the facility.
It’s okay to have more than one—but take the time to list them all out. Once you have a good list of your goals, it’ll be easier to identify which metrics make sense to track.
Choose your data points for the EHS dashboard
The next step is to assign data points to each of the goals you outlined in the first step. Go one by one and determine what type of information you’ll need to assess that goal.
For example, if one of your goals is to decrease the number of safety incidents in a work area, you’ll need to be able to track incidents by work area. Just using a general incident rate won’t give you the insight you need to review this goal.
A comprehensive EHS dashboard should have several data points (both qualitative and quantitative). Ensure that your dashboard accurately reflects your vision for the program before you start making decisions based off the information in it.
Source your data for your EHS dashboard
By now, you should have all your data points picked out. If so, your next step is to figure out how you’re going to source all of that data.
- Will you calculate it manually via spreadsheet?
- Will you use EHS software to collect information?
- Will you create a tool that automatically calculates the data you need?
Not only should you look at the type of source, but you should also look at the quality of the data source. If your team struggles to consistently track data by hand, you might want to switch to a digital solution.
An EHS dashboard is only as accurate as what you put into it. Verify that your KPI’s are coming from valid, up-to-date sources.
Design the EHS dashboard interface
The final step in this process is actually designing the dashboard and importing all your data. Like I mentioned before, how you want to go about this depends on the type of data you’ll be using.
Many EHS managers opt for a manual dashboard because their operations allow for a simpler setup. Complex operations, especially those involving multiple locations, however, may benefit more from a metric tracking system.
If you plan to go the manual route, just make sure you remember to regularly update the inputs. After all, working off of outdated information is the surest way to get nowhere.
An EHS dashboard that aligns with your program goals and has the most recent data can completely transform how you choose your improvement projects. I’d highly recommend going through this setup process to improve your understanding of your site’s EHS performance.