
Companies tend to view EHS programs as a cost of doing business. In reality, health and safety departments play a direct role in your long-term success as a company. EHS performance metrics can help you uncover hidden risks, drive process efficiency, and create a more resilient business from the ground up.
How EHS Metrics Drive Business Performance
What does success look like for your business? Whether it’s ruling the largest market share amongst your competitors or simply being able to make payroll each month, you can’t separate safety from these outcomes.
EHS performance metrics like incident rates or training completion give you measurable insights into your operational efficiency and risk levels.
Safety programs lead to better outcomes across the board. They prevent costly injuries, operational disruptions, and compliance violations. They build a strong safety culture which increases employee engagement and reduces turnover. And they foster a proactive approach that leads to greater innovation and long-term sustainability.
All these factors impact the bottom line. And the only way to manage them effectively is to measure them consistently.
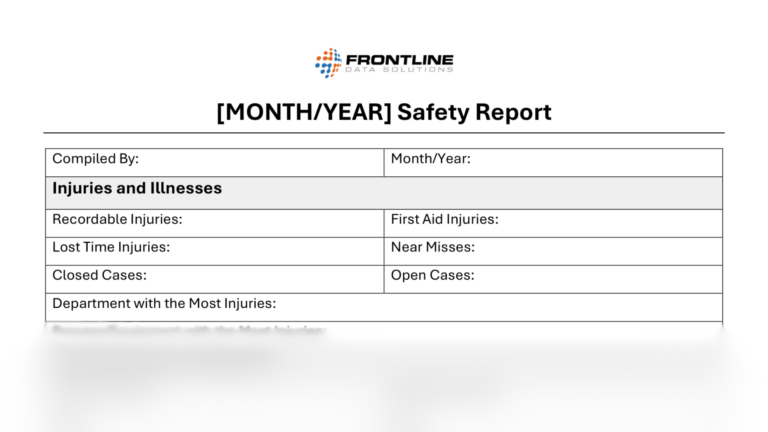
Free Template!
Use this template to compile a monthly safety report of all the EHS performance metrics you’re tracking.
Top EHS Performance Metrics to Track
Every company will have a different set of KPIs to measure success. But in terms of health and safety there are key data points that you should track regardless of your industry to gauge your site’s performance.
- Incident Rates: Number and rate of workplace injuries, illnesses, and fatalities. These also include the number and rate of environmental incidents such as spills or releases.
- Compliance with Legal and Regulatory requirements: Percentage of compliance with relevant EHS laws and regulations. Also, the number of inspections and citations received.
- Employee Engagement and Participation: Percentage of employees who have received EHS training. The number of employee suggestions for EHS improvement and the number of employee-led EHS initiatives.
- EHS Management System Effectiveness: Percentage of such EHS performance metrics that show management system elements are implemented and maintained. Note that this also includes the percentage of compliant management system elements.
- EHS Performance Improvement: Number and rate of EHS incidents over time. Also, the percentage of enhancement in EHS performance from year to year.
- Return on Investment (ROI) on EHS Initiatives: Costs and benefits of EHS initiatives, such as the costs of implementing an EHS management system. Compare these costs to the reduction in workplace incidents and injuries.
- Environmental Indicators: Energy consumption, water usage, waste generated, CO2 emissions, etc.
- Human Exposure and Health Indicators: Noise levels, air quality, chemical exposure, etc.
It’s important to note that these are just examples of possible EHS performance metrics. Your leadership team should choose the data points that align best with your operational goals.
Translating Safety Metrics into Business Resilience
You can use EHS performance metrics to build a more resilient business by using them to identify and lower risks. The better you track data, the better predictions you’ll be able to make. This means you’ll implement more effective control measures long before risks lead to costs.
Here are the top ways you can use safety metrics to lower risk:
- Spot negative trends before they lead to incidents or shutdowns.
- Identify high-risk areas that need additional training, controls, or staffing.
- Compare performance across departments, facilities, or time periods to see where you’re making progress and where you’re falling behind.
- Prioritize investments in EHS programs, training, and technology based on the areas that will have the greatest business impact.
This proactive approach towards EHS management will help protect your business from future risk. The more you do to find and fix issues at the source, the less likely you’ll be to experience operational shutdowns, injuries, quality issues, and more.
Common EHS Data Failure Modes
As always, your ability to build resilience depends on the quality of your data. Here are some common failure modes related to safety performance metrics that you should watch out for:
- Lack of Data: Without accurate and reliable data, it can be difficult for leadership to effectively monitor and improve safety for frontline workers.
- Limited Focus on Specific Hazards: While key safety metrics provide a general overview of EHS performance, they don’t always fully address specific hazards or risks that are unique to an organization or industry.
- Insufficient Employee Engagement: Without buy-in from frontline workers, the control measures you implement based on EHS metrics won’t be as effective.
- Limited Data Score: If safety KPIs only cover specific areas or locations, and not the entire organization, then you might miss important insights from other sources.
- Lack of Actionable Information: Sometimes, the data you collect won’t be something you can do anything about, especially if you have a limited budget.
- Infrequent Data Collection: If you don’t collect data on a regular basis, then you might not have enough information to capture real-time performance and emerging trends.
- Inadequate Data Analysis: Your data analysis must go deep enough to uncover the true cause of any risks you find.
When you’re setting up your process for tracking safety KPIs, it’s important to anticipate these failure modes.
Using EHS Software to Track Metrics and Improve Processes
Tracking safety performance metrics manually can slow down your response to emerging risks. That’s where EHS software becomes a game-changer. With the right system in place, you’ll be able to collect, analyze, and act upon data in real time to avoid costly incidents and oversights.
EHS software drives smarter improvements by helping you identify trends and patterns as early as possible. Centralized data that’s organized digitally gives you access to better insights and leads to better decision-making.
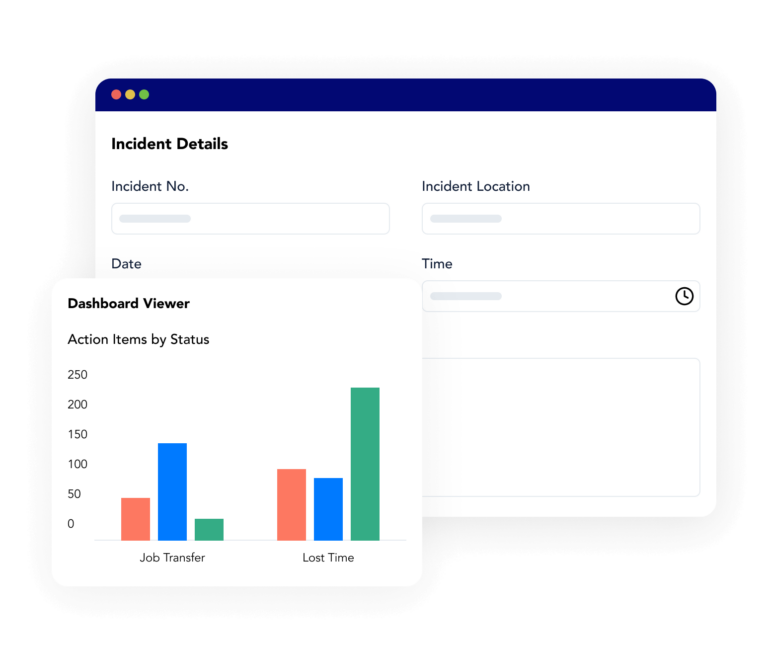
Frontline ACT action tracking software, for example, supports accountability by automating corrective action assignments, reminders, training requirements, and more. This enables proactive risk control by putting the focus on leading indicators like training completion or on-time action items.
Here are some tips for using EHS performance metrics effectively:
- Use both leading and lagging indicators to judge your program’s performance.
- Perform monthly or quarterly data review to help you stay ahead of issues and adjust your strategy.
- Share data across departments so everyone from safety to HR can make better decisions.
- Clearly define success for each metric you track, so everyone is on the same page.
- Start by tracking a few metrics well and then expand your program from there.
If you want to build a safer, more resilient business, you have to measure what matters. EHS performance metrics help you understand where your risks are, how well your programs are working, and what you need to do next. Over time, you can build a feedback loop for continuous improvement with software. It’s about learning from the data to make your processes safer, stronger, and more efficient.