

Written By:
Monica Kinsey
Monica is a former warehouse operations manager with a passion for workplace safety. Her favorite topics to cover include safety leadership and continuous improvement.
One of the more tedious areas of EHS management is deciding how you’ll report your performance to senior leadership. Therefore, to create an effective monthly safety report, you need to select the right metrics, collect accurate data, and organize it in a way that clearly reflects your team’s progress.
A simple way to do this is to create a template for your team to fill out and review together during your weekly meeting. Including pertinent details on the monthly safety is crucial. Once that is done, you can take the information you compile as a team and combine it into one master report that you submit monthly to upper management.
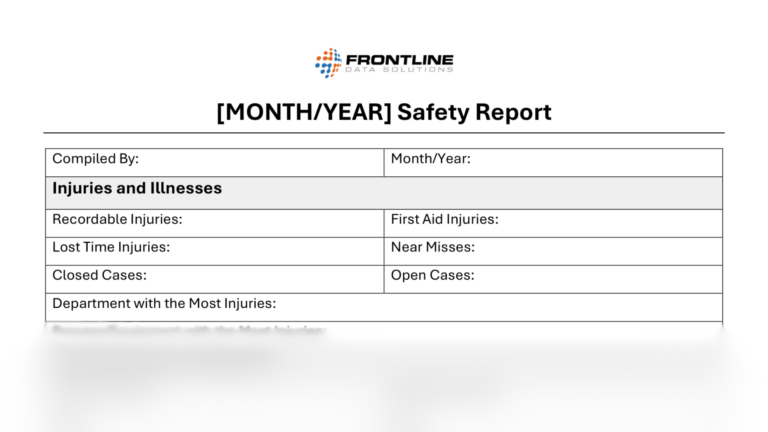
We’ve provided a basic template that you can use to get started creating a safety report below. In each section of this post, we’ll walk through the types of information you should consider adding to your report.
Free template!
Use this simple template to create a safety report for your team that is updated monthly.
Injury metrics for your monthly safety report
Reporting injury data is a non-negotiable section of a monthly recap. Here are some metrics you can use for a comprehensive report, helping communicate your site’s performance in this area.
Near misses
If you don’t currently document near misses, you need to. They are a lagging indicator of how your site’s risk prevention strategies are/are not working. Ensuring they’re part of the monthly data collection is vital for your safety report.
First aid
A first aid event is anything that results in an injury needing first aid care on site but not further medical treatment. An example of this would be a team member who superficially cuts themselves and needs a Band-Aid but no further treatment for their cut. Such events should be documented in your monthly safety review.
Lost time injuries
As a result, these types of injuries can quickly add up. Therefore, include them in the monthly report to keep upper management informed about any pending or ongoing lost time injury cases.
OSHA recordable incidents
A safety report, compiled monthly, should list all recordable incidents for that period. To improve clarity, consider organizing them by type of incident, type of injury or damage, and other relevant categories. This approach helps leadership better understand the underlying issues.
In addition, include the root causes identified for each incident and outline the corrective actions you’re taking to prevent them from happening again.
Key performance indicators for your monthly safety report
Your report should have a section for your department’s KPI’s. This monthly section should include common safety KPI’s like:
- Safety training metrics (training past due, test scores, etc.)
- Workplace safety audit results
- Injury rates such as the TRIR
- Employee perception survey results
- Regulatory inspections
Safety wins
Don’t forget to focus on the wins you’ve had in the past month. Create space in your monthly reporting to highlight things like:
- Teams goals you’ve reached
- Increases in training performance
- New safety initiatives
- Process improvements
You may also want to provide updates on the activities that your safety committee is working on or to shout out individual members of your team.
Safety challenges for your monthly safety report
No report would be complete without a section on areas of improvement or current challenges you’re trying to solve. The monthly report is your chance to notify upper management of any barriers your department is facing.
In addition to the safety challenges, include the things you’re doing to overcome them. Share your plan for addressing these problems, and in your monthly write-up, any support you’ll need to do so should also be mentioned.